Option B x² – 17x + 72 = 0 x = 8, 9 6y² – 31y + 35 = 0 y = 1.6, 3.5 x>y
(i). x² – 37x + 300 = 0 (ii). y² – 43y + 372 = 0
x > y
y >= x
No relation between x and y.
y > x
x >= y
Option C x² – 37x + 300 = 0 x = 25, 12 y² – 43y + 372 = 0 y = 31, 12 No relation between x and y.
(i) 12x² + 11x + 2 = 0 (ii) 12y²+ 7y + 1 = 0
x >= y
y >= x
y > x
x > y
No relation between x and y.
Option E (i) 12x² + 8x + 3x + 2 = 0 4x (3x + 2) + 1 (3x + 2) = 0 x = –2/3 , –1/4 (ii) 12y² + 7y + 1 = 0 12y² + 4y + 3y + 1 = 0 4y (3y + 1) +1 (3y + 1) = 0 y = –1/3 , –1/4 No relation between x and y.
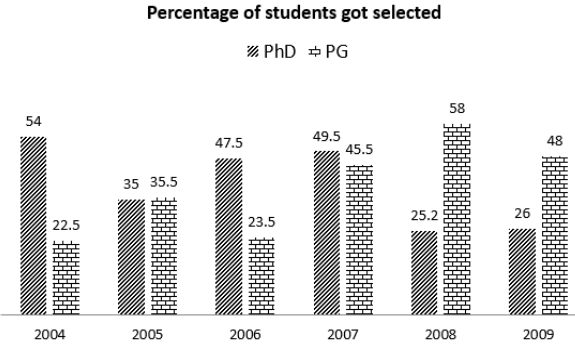
Directions(6-10): Read the following graph carefully and answer the questions given below: Delhi University offers two courses PG and PhD. The information regarding number of students applied for these two courses and among how many got selected from year 2004-2009 are shown by the graph given below:
Average number of students got selected for PhD program is by what percent more/less the average number of students applied for PG programs.
65% less
77% less
68% less
72% less
70% less
Option D Average students selected for PhD program = (2160+4550+2850+4455+3402+3900)/6 = 21317/6 = 3553 (approx) Average number of student applied for PG program = (8000+17000 +10000 +14000 +16500 +11000)/6 = 76500/6 = 12750 Required percentage = (12750 −3553)/12750 × 100 = 72% less
Which year shows the highest quantum difference between the number of students applied and got selected for PhD programs.
2008
2006
2009
2007
2005
Option C Difference for year 2004 = 4000 − 2160 = 1840 For year, 2005 = 13000 −4550 = 8450 For year, 2006 = 6000 − 2850 = 3150 For year, 2007 = 9000 − 4455 = 4545 For year, 2008 = 13500 −3402 = 10098 For year, 2009 = 15000 −3900 = 11100 2009
What is the respective ratio of the percentage increase/decrease in the students got selected for PG in 2005 over Year 2004 to the percentage increase/decrease in the number of students applied for PhD in year 2008 over year 2007.
47 ∶ 14
47 ∶ 10
49 ∶ 12
41 ∶ 10
47 ∶ 13
Option B Percentage increase in selected students in PG in 2005= (6035−1800)/1800 × 100 = 235% Percentage increase in number of applied students in PhD in 2008 = (13500 −9000)/9000 × 100 = 50% Required ratio = 235 ∶ 50 = 47 ∶ 10
Find the ratio of Number of students selected in 2005, 2007 and 2009 for PhD course to number of students applied in 2004, 2006 and 2008 for same course.
2647 ∶ 4400
2551 ∶ 4300
2577 ∶ 4700
2581 ∶ 4700
2581 ∶ 4100
Option D Number of students selected in 2005, 2007 and 2009 for PhD course = 13000 × 35/100 +9000 × 49.5/100 + 15000 × 26/100 = 4550 +4455 +3900 = 12905 Number of students applied in 2004, 2006 and 2008 for PhD course = 4000 + 6000 +13500 = 23500 Ratio = 12905 ∶ 23500 = 2581 ∶ 4700
In PG program which year shows highest percentage increase/decrease in number of student selected over previous year?
2006
2009
2007
2005
2008
Option D Percentage increase/decrease in the number of selected students For year 2005 = 6035−1800/1800 × 100 = 235% For year 2006 = 6035−2350/6035 × 100 = 61% For year 2007 = 6370−2350/2350 × 100 = 171% For year 2008 = 9570−6370/6370 × 100 = 50% For year 2009 = 9570−5280/9570 × 100 = 44.8% 2005

No comments:
Post a Comment