- If the selection rate in SSC in 2017 is 2.5% then find the number of candidates who took the SSC examination in 2017.
1600010000176001250011500Option C
Required number of candidates who gave the SSC examination in 2017 = 440/0.025 = 17600
- If the ratio of the creamy layer candidates of OBC category selected in all the three exams together is 3:5 resp. Find the number of creamy layer OBC candidates selected in all the three exams together.
222250246235220Option C
Require number of creamy layer OBC candidates selected in all the three exams = 3/8*656 = 246
- If 2% of the total General candidates ( who took the exam constituted 40% of the State Exam candidates ) who took the State exam were selected . Find the total number of candidates who took State exam in 2017.
9452099000925009000089000Option C
Total number of candidates who gave State exam in 2017 = { (740/0.02)}/0.4 = 92500
- Find the number of candidates selected in Banking in 2018 which is 150 more than that of the previous year.
11001225100210201550Option D
Number of candidates who selected in Banking in 2018 = 870+150 =1020
- Find the average number of SC candidates selected in each of the given exams in 2017.
889593100103Option E
Required average = 309/3 = 103
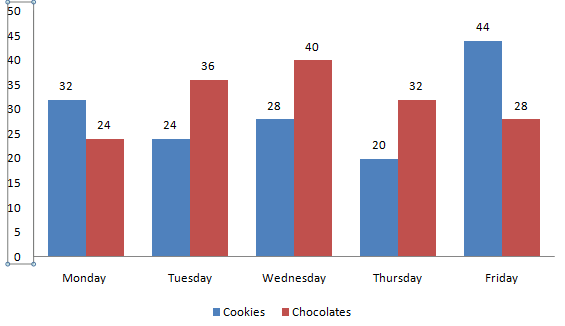
Directions(6-10): The given chart shows the Cookies and Chocolates sold and their prices on different days of week by a bakery.
- Find the total revenue of the bakery on Wednesday.
555500568524515Option C
Number of Cookies and Chocolates sold on Wednesday resp. = 28 and 40
Total revenue of the bakery on Friday = (28*6)+(40*10) = Rs.568
- Find the difference between average number of Chocolates sold on Monday and Wednesday taken together and average number of Cookies sold on Wednesday and Thursday taken together.
78964Option B
Average number of Chocolates sold on Monday and Wednesday= 64/2 = 32
Average number of Chocolates sold on Wednesday and Thursday = 48/2 = 24
Difference = 32-24 = 8
- Find the average revenue generated from Cookies on Monday, Tuesday , Wednesday and Thursday taken together.
100115102111121Option E
Average = (32*5+24*4+28*6+20*3)/4 = Rs.121
- If the number of Chocolates sold on Saturday is 12.5% less than the number of Cookies sold on Monday. Find the difference between the number of Chocolates sold on Saturday and number of Cookies sold on Friday.
1610151912Option A
Number of Cookies sold on Saturday = 32*(100 -12.5)% = 28
Number of Cookies on Friday = 44
Diiference = 44-28 = 16
- Revenue of which Chocolate is minimum ?
WednesdayMondayFridayThursdayTuesdayOption C
24*8=192
36*6= 216
40*10=400
32*5=160
28*4=112
Friday


No comments:
Post a Comment