- What was the ratio of the total number of units sold by company P and R combined in 2002 to the total number of units sold by company P and R combined in 2004?
13:1711:1014:1511:1516:17Option D
Total number of units sold by company P and R combined in 2002 = 36+30 = 66
Total number of units sold by company P and R combined in 2004 = 42+48 = 90
Required ratio = 11:15
- In 2003, the number of units sold by company Q was what percentage of the number of units sold by company P?
60%68%62%70%72%Option E
Required% = (36/50)*100 = 72%
- What was the average of the number of units sold by company Q during the period 2002 to 2004?
2426323037Option C
Required average = (20+36+40)/3 = 32
- If in 2005, the number of units sold by each of the companies increased by 50% as compared to 2004, what was the total number of units sold by 3 companies combined in 2005?
189195190200187Option B
Total number of units = 1.5*(42+40+48) = 195
- What was the difference between the total number of units of the article sold by the 3 companies combined in 2003 and that of 2004?
64352Option A
Total number of units of the article sold by the 3 companies combined in 2003 = 50+36+38 = 124
Total number of units of the article sold by the 3 companies combined in 2004 = 42+40+48 = 130
Difference = 6
Directions(6-10): Answer the following questions based on given chart.
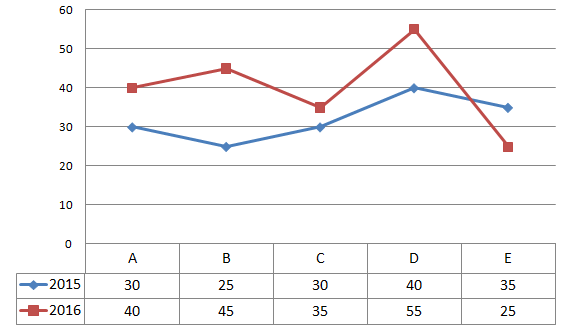
The line graph given below shows the production of rice (lakh tonnes) during the period 2015 and 2016 in five different states (A,B,C , D and E).
Production of rice (in lakh tonnes) by different states in 2015 and 2016.
- Total production of rice in two years by state C is approximately what percentage of the total production of rice by all the five stated together in two years?
17%12%14%18%10%Option D
Total production of rice in two years by state C = 65 lakh tonnes
Total production of rice by all the five stated together in two years = 360 lakh tonnes
Required% = 65/360*100 = 18%
- Find the ratio of the average production of rice by all the fives states in the year 2015 to that of the same in 2016?
5:34:51:35:72:3Option B
Average production in 2015 = 160/5 = 32 lakh tonnes
Average production in 2016 = 200/5 = 40 lakh tonnes
Required ratio = 32:40 = 4:5
- If the average consumption of rice of each of the given states in a year is 33 lakh tonnes, what is the difference between the average consumption and average production of rice a state in a year ?
6 lakh tonnes4 lakh tonnes7 lakh tonnes5 lakh tonnes3 lakh tonnesOption E
Average consumption of a country in a year = 360/(5*2) = 36 lakh tonnes
Average consumption in a year = 33 lakh tonnes
Difference = 3 lakh tonnes
- If the percentage increase in total production of rice in 2015 is 25% with respect to the previous year , find the total production of rice by all the states in 2014?
115 lakh tonnes113 lakh tonnes128 lakh tonnes120 lakh tonnes108 lakh tonnesOption C
Total production of rice in 2015 = 160 lakh tonnes
Total production of rice in 2014 = 160/1.25 = 128 lakh tonnes
- Find the difference between the total production of rice by state A and the total production of rice by state B in both the years together.
23140Option E
Difference = 70 – 70 = 0

No comments:
Post a Comment