- Find the ratio of the number of males to females who have driving licence from city A.
11:138:96:711:913:15Option D
Ratio = 55:45 = 11:9
- Find the number of males who have driving licence in city C.
6070648179Option B
Number of males = 70
- Number of males who have driving licence from city B is what percentage of number of females who have driving licence from city B?
100%110%95%80%90%Option A
Required% = 40/40*100 = 100%
- Find the difference between number of male and female who have driving licence from city E.
2040105030Option E
Difference = 90 – 60 = 30
- How many people have driving licence in city D?
4050306070Option B
Number of people = 50
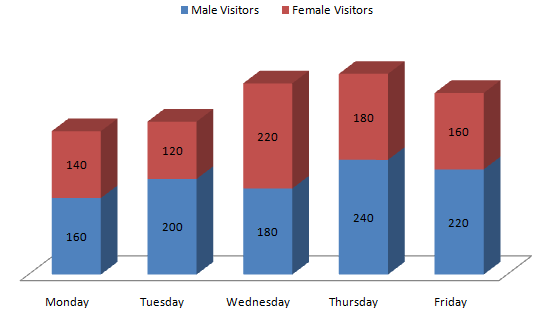
Directions(6-10): The graph shows the number of male visitors and female visitors to CCD on Monday, Tuesday, Wednesday, Thursday and Friday resp.
- What is the average number of male visitors visiting on each of the given day?
195180175200210Option D
Average = (160+200+180+240+220)/5 = 200
- What is the ratio of male visitors on Monday and Tuesday together to female visitors on Wednesday and Thursday together?
12:137:69:812:119:10Option E
Ratio = (160+200): (220+180) = 360:400 = 9:10
- Total number of visitors on Monday is how much percent more or less than the total number of visitors on Wednesday?
32%30%18%20%25%Option E
Required Difference = 400 – 300 = 100
Required% = 100/400*100 = 25%
- Number of male and female visitors who visited the CCD on Saturday is 25% and 35% more than that of the same on Thursday. Find the total number of visitors who visited on Saturday.
515510528543520Option D
Total visitors on Saturday =1.25*240 + 1.35*180 = 300+243 = 543
- Out of the total number of visitors who visited in all five days together, the ratio of tea and coffee visitors is 11:9 resp. Find the number of tea visitors who visited from Monday to Friday to the CCD.
99511008458501001Option E
Total number of visitors who visited from Monday to Friday to the CCD = 300+320+400+420+380
= 1820
Required number = 11/20*1820 = 1001

Is some data missing in Q1-5?
ReplyDelete