
- What is the average invalid votes for village A for the given years(approximate)?
800600300200400Option E
Required average = [250+550+400]/3 = 400
- If total vote polled in village B in year 2000 ,25% polled by females and total valid-female-votes are 1875 then find the number of valid votes polled by males ?
51105005515157255500Option D
Votes polled by females = 25 100 × 8000 = 2000 Votes polled by males = 6000 Valid female votes = 1875 Valid male votes = 7600 − 1875 = 5725
- Total votes of village A in 2000 is what percent of valid votes polled in village C in 2010?
33%44%37%30%41%Option C
Required percentage = 2500/6750 × 100 == 37%
- What is the average of valid votes polled in year 2000?
45544141385040004700Option E
Required average = [2250+7600+4250]/3 = 4700
- Valid votes polled in village C in 2005 is by what percent less than total votes polled in village B in 2000?
30.9%42.5%2.82%33.3%40.1%Option B
Required percentage = [8000−4600]/8000 × 100 ≈ 42.5%
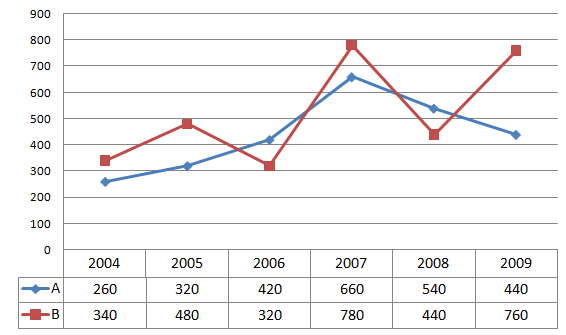
Directions(6-10): Study the following table and answer the questions that follow.
Given line graph shows the number of students appeared from state A and state B in an examination.
- Number of students appeared from state B in 2009 is about what percent of total students appeared from state A?
23%22%29%25%20%Option C
Required percent = 760/2640 × 100 = 28.78% == 29%
- What is the difference between the total number of students from state A in 2004 and 2005 together and those of state B in 2008 and 2009 together?
610630620660640Option C
Total students from state A in 2004 and 2005 = 260 + 320 = 580 Total students from state B in 2008 and 2009 = 440 + 760 = 1200 Difference = 1200 − 580 = 620
- What is the difference between average number of students from state A and state B?
9080605040Option B
Difference = 3120/6 – 2640/6 = 520 −440 = 80
- If in 2010 the number of students appeared from state A is increase by 10%and those from state B increased by 15% as compared to the number of students from respective states in year 2009,then what is the ratio of number of students from state A and state B in 2010?
293/435211/400222/433242/437241/413Option D
Required ratio = [110×440/100]/[115×760/100] = 484/874 = 242/437
- What is the ratio of number of students appeared in examination from state B in 2004 ,2006 and 2008 to the number of students appeared from state A in 2005,2007 and 2009?
50/7353/6851/7055/7152/73Option D
Required Ratio = [340+320+440]/[320+660+440] = 1100/1420 = 55/71
No comments:
Post a Comment