
- Find the ratio between the total number of students went to college in the year 2004 and the total number of peoples who completed their school in 2008 ?306 : 12306 : 12536 : 12530 : 125306 : 11Option B
The total number of students employed in MNC companies in the year 2014
= > 1800 * (68/100)
The total number of students who completed their UG degree in 2018 and doing business
= > 2500 * (20/100)
Required ratio = [1800 * (68/100)] : [2500 * (20/100)]
= > 306 : 125
- Find the average number of students who completed school in all the given years together?20502060207020902000Option B
The average number of students who completed their UG degree in all the given years together
= > (1800 + 2400 + 1600 + 2000 + 2500) / 5
= > (10300/5) = 2060
- Find the difference between the total number of boys who completed their school in the year 2005 to that of total number of girls who completed their school in the year 2007?400600100500700Option D
The total number of males who completed their degree in the year 2015
= > 2400 * (2/3) = 1600
The total number of females who completed their degree in the year 2017
= > 2000 * (11/20) = 1100
Required difference = 1600 – 1100 = 500
- The total number of students went to college in the year 2005 is approximately what percentage of total number ofwent to college in the year 2007?447788101103Option E
The total number of peoples employed in MNC companies in the year 2015
= > 2400 * (72/100) = 1728
The total number of peoples employed in MNC companies in the year 2017
= > 2000 * (84/100) = 1680
Required % = (1728/1680) * 100 = 102.85 % = 103 %
- The total number of students who completed their school in 2006 and what percentage more/less than the total number of girl students who completed their school in the year 2004?5051525354Option C
The total number of peoples who completed their UG degree in 2016 and doing business
= > 1600 * (24/100) = 384
The total number of female students who completed their UG degree in the year 2014
= > 1800 * (4/9) = 800
Required % = [(800 – 384) / 800] * 100 = 52 % less
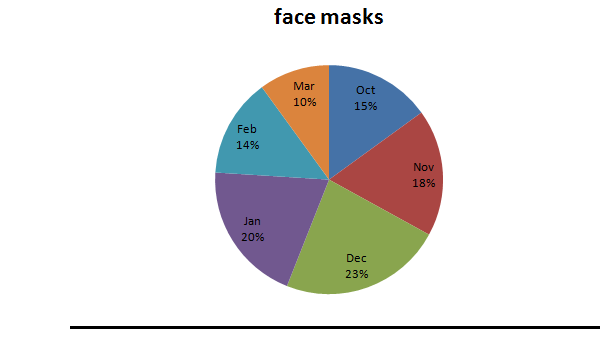
- Find the difference between the total number of face masks imported by Micco lab in Oct and Feb together to that of total number of face masks imported by company B in Nov and Dec together, if the ratio between the total face masks imported by Micco lab to that of company B is 3 : 4 and the percentage distribution of total face masks imported by company B is same as Micco lab.38501290239034501200Option A
The total number of face masks imported by Micco lab in Oct and Feb together
= >15000 * (29/100) = 4350
The total number of face masks imported by company B in Nov and Dec together
= >[15000 * 4/ 3] * (41/100) = 8200
Required difference = 8200 – 4350 = 3850
- Find the central angle corresponding to the total number of face masks imported by Micco lab in Jan and Mar together 11201130108019091000Option C
The central angle corresponding to the total number of face masks imported by Micco lab in Jan and Mar together in the year 2018= (30 / 100) * 360 = 1080
- Find the difference between the average number of face masks imported by Micco lab in Nov and Dec together to that of the average number of face masks imported by Micco lab in Feb and Mar together.13451275455565651455Option B
The average number of face masks imported by Micco lab in Nov and Dec together
= > 15000 * (41/100) * (1/2) = 3075
The average number of face masks imported by Micco lab in Feb and Mare together
= > 15000 * (24/100) * (1/2) = 1800
Required difference = 3075 – 1800 = 1275
- If the total number of face masks imported by Micco lab in Aug is 45% more than the total number of face masks imported by the same company in Jan and the total number of face masks imported by Micco lab in Sep 2018 is 60% more than the total number of face masks imported by the same company in Feb then find the total number of face masks imported by the Micco lab in Aug and Sep together.77103490559078007000Option A
The total number of face masks imported by the Micco lab in Aug and Sep together
= >15000 * (20/100) * (145/100) + 15000 * (14/100) * (160/100)
= > 4350 + 3360 = 7710
- Find the ratio between the total number of face masks imported by Micco lab in Nov and Jan together to that of total number of face masks imported by Micco lab in Oct and Mar together.38: 2518: 2538: 1538: 238: 25Option A
The total number of face masks imported by Micco lab in Nov and Jan together
= > 15000 * (38/100)
The total number of face masks imported by Micco lab in Oct and Mar together
= > 15000 * (25/100)
Required ratio = [15000 * (38/100)]: [15000 * (25/100)]
=38: 25
The following pie chart shows the percentage distribution of total number of face masks imported by Micco lab in 6 different months to china.
The solutions are different from the given questions....how come you assumed 15000 for the second DI
ReplyDelete