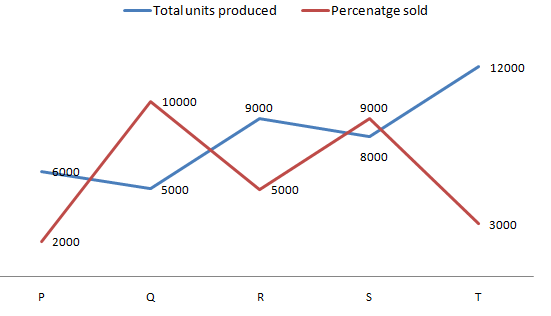
- What is the difference between the number of units which remain unsold by company S and T?
50005200460040004800Option C
Required Difference = 6600 -2000 = 4600
- Number of units sold by company R is how much percent more or less than the number of units sold by company S?
14.2%17.5%19.7%22.2%10.9%Option B
Percentage = [(6000 - 4950)/6000 ]*100 = 17.5%
- What is the average number of unsold units of companies P,R and T together?
42003215350047503550Option D
Average = (3600+4050+6600)/3 = 4750
- Company R has three types of unsold products (P,Q,R), out of which 60% were of the type P while type Q and R were in the ratio 5:4 resp. Find the number of type Q products of company R which remain unsold.
985900850800788Option B
Total number of products of type Q and type R were unsold = 0.40*4050 = 1620
Number of type Q which remain unsold = 5/9*1620 = 900
- What is the total number of units sold by company P and Q together in 2010?
75005400700064006200Option D
Total number of units = 2400+4000 = 6400
Directions(6-10): Answer the questions based on the given information.
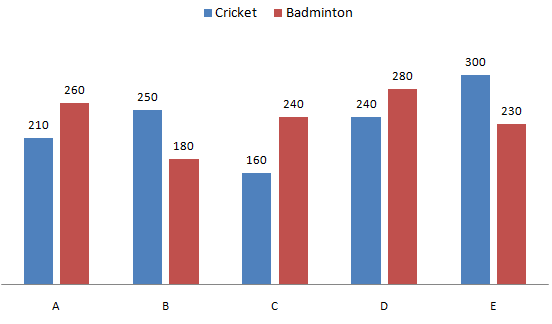
The graph given below shows the number of students who play Cricket and Badminton from five different schools. One student play one game.
- Find the average number of students who play Badminton in school A,B and D.
200180190240210Option D
Required Average = (260+180+280)/3 = 240
- What is the difference between the average number of students who play Cricket in school A and B together and the average number of students who play Badminton in school C and D?
2025323045Option D
Difference = (240+280)/2 – (210+250)/2 = 30
- If the ratio of the number of boys to girls who play Cricket in school D is 2:3, Find the number of boys who play Cricket in school D?
80100908596Option E
Number = (240/5)*2 = 96
- Find the ratio of the number of students who play Cricket in school C to the number of students who play Badminton in B.
4:55:67:52:38:9Option E
Ratio = 160:180 = 8:9
- The number of students who play Cricket in E is how much percent less than the number of students who play Badminton in A and C together?
20%30%40%50%60%Option C
Difference = (260+240)- 300 = 200
Percentage = 200/500*100 = 40%

No comments:
Post a Comment